
Energy Profile Diagrams
Chemists use Energy Profile Diagrams (also called Reaction Coordinate Diagrams) to visualize the energy changes during a reaction. They plot the potential energy of the molecules on the vertical axis (y-axis) against the progress of the reaction on the horizontal axis (x-axis).
Key Features to Label on ALL Diagrams:
- Reactants: The energy level at the start of the reaction.
- Products: The energy level at the end of the reaction.
- Activation Energy (Ea): The minimum amount of energy required for the reactants to successfully collide and transform into products. It is the “energy barrier” that must be overcome. Represented by the “hill” from the reactants to the peak of the curve.
- Enthalpy Change (ΔH): The overall difference in energy between the products and the reactants. Calculated as ΔH = H(products) – H(reactants) .
- Transition State: The highest point on the diagram, representing an unstable, high-energy state where bonds are partially broken and formed.
Diagram 1: Energy Profile Diagram for an Exothermic Reaction
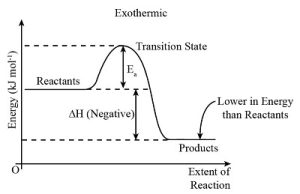
- Shape: The curve starts at the reactants, goes up to the peak (Ea), and then descends to a lower energy level for the products.
- Reactants: Located at a relatively high energy level.
- Products: Located at a relatively low energy level.
- ΔH: The arrow pointing downwards from reactants to products. It is a negative value.
Visual Check: The products are lower on the y-axis than the reactants.
Diagram 2: Energy Profile Diagram for an Endothermic Reaction
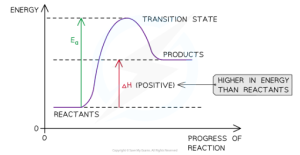
- Shape: The curve starts at the reactants, goes up to the peak (Ea), and then descends slightly, but finishes at a higher energy level than where it started.
- Reactants: Located at a relatively low energy level.
- Products: Located at a relatively high energy level.
- ΔH: The arrow pointing upwards from reactants to products. It is a positive value.
Visual Check: The products are higher on the y-axis than the reactants.